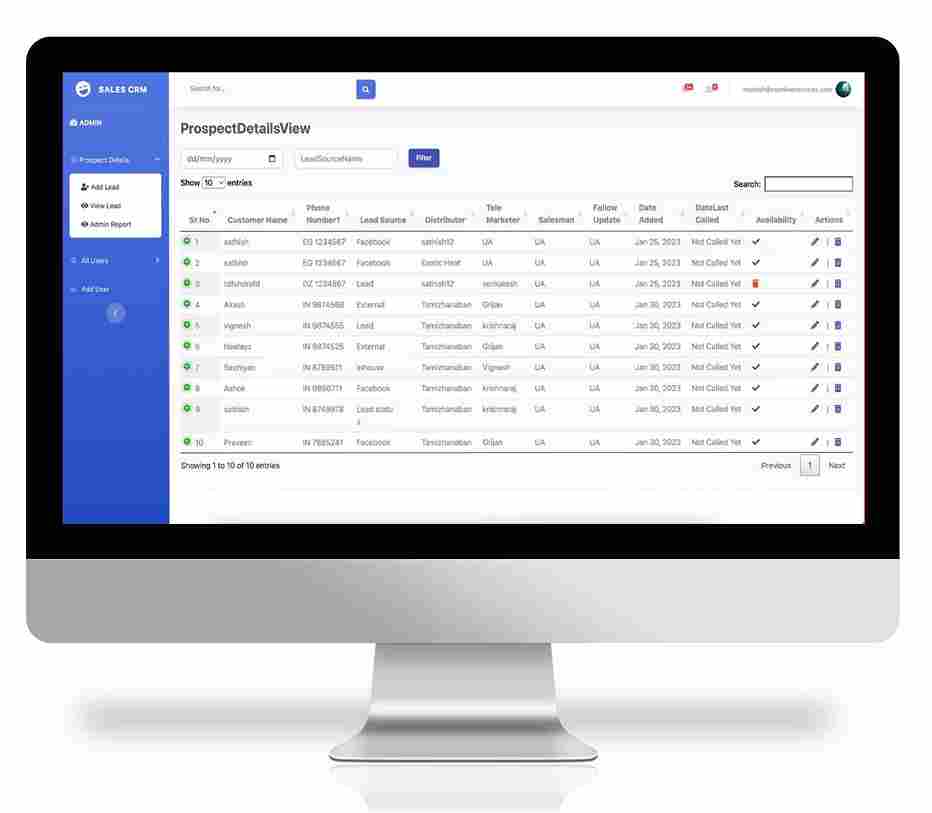


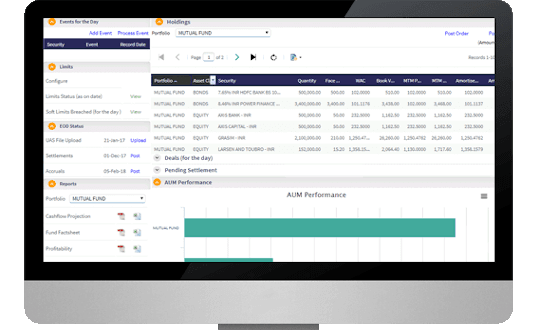
Real Estate Mentor® : CRM
Mobile Application
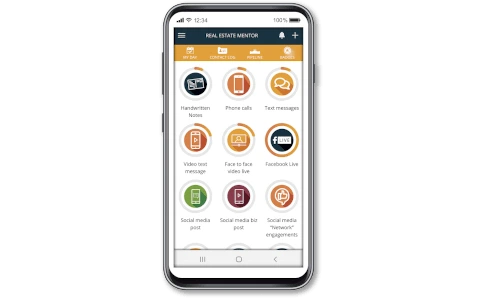
Real Estate Mentor® is a mobile CRM software designed by real estate agents for real estate agents, to help you achieve your real estate goals. The only one of is kind, all-in-one mobile real estate solution with incredible CRM features